Computer Science Test Final
Computer Science
Section titled “Computer Science”IT Domain – Intelligent Detection and Real-Time Web Monitoring
Section titled “IT Domain – Intelligent Detection and Real-Time Web Monitoring”The Smart Conveyor System project aims to create an intelligent waste-sorting conveyor for TEKBOT CITY. Using an ATmega328P microcontroller, color sensor, and presence detector, the system identifies and sorts four types of waste cubes (green, yellow, red, blue). It activates the conveyor motor only when needed and sends real-time data to a Flask-based web dashboard, allowing administrators to monitor the count of each waste type. The web interface features responsive design, battery status, audio feedback, and displays TEKBOT and TRC 2025 logos. The solution combines embedded C++ logic, Python Flask server, and modern web technologies for efficient waste management and real-time monitoring.
🎯 Objectives • 📝 Summary • 🔌 Hardware • 🌐 Technologies & Architecture • 🖥️ Web Interface • 💻 Source Code • 🧪 Results & Testing • 📚 Documentation
🎯 Objectives
Section titled “🎯 Objectives”Summary
This project aims to automate the sorting of four types of waste using an intelligent conveyor, with detection, identification, and real-time monitoring via a web interface.
The objective is to develop an intelligent conveyor system capable of identifying and sorting 4 types of waste represented by colored cubes (green, yellow, red, blue).
…
The objective is to develop an intelligent conveyor system capable of identifying and sorting 4 types of waste represented by colored cubes (green, yellow, red, blue).
The system should:
- Detect the presence of a waste item
- Identify its color with a color sensor
- Trigger the conveyor motor only when needed
- Transmit real-time data to a web dashboard showing the count of each waste type
📝 Summary
Section titled “📝 Summary”Key Takeaway
The system uses an Arduino to detect and sort waste, transmitting data to a modern web dashboard for real-time supervision.
This project implements a smart waste-sorting conveyor using a microcontroller (ATmega328P / Arduino Nano) connected to a color sensor and a presence detector.
An embedded program detects waste, identifies its color, and communicates the information to a Flask-based web interface in real time via serial communication.
Administrators can monitor sorted waste quantities per color through a modern, responsive dashboard including the TEKBOT and TRC 2025 logos.
🔌 Hardware
Section titled “🔌 Hardware”Summary
The hardware includes an ATmega328P microcontroller, color sensor, presence detector, DC motor, and power supply, all working together to automate waste sorting.
| Component | Description |
|---|---|
| Microcontroller | ATmega328P |
| Color Sensor | TCS34725 |
| Presence Detection | KY-008 laser module with photodiode / LDR |
| Conveyor Motor | DC motor controlled via driver (L298N) |
| Power Supply | Lithium battery block |
| Waste Items | 30 mm cubes (green, yellow, red, blue) |
📁 Repository Structure
Section titled “📁 Repository Structure”Key Takeaway
The repository is organized by embedded code, web server, models, captures, and documentation for easy navigation.
smart_conveyor/├── arduino/│ ├── KeepDataColor.ino│ └── algoDistanceColor.ino├── web/│ ├── app.py│ ├── static/│ ├── templates/│ │ └── index.html├── models/│ └── conveyor.sldprt├── capture final/│ └── web_interface.png└── README.md🌐 Technologies & Architecture
Section titled “🌐 Technologies & Architecture”Summary
The solution combines embedded C++, Python Flask, HTML/CSS/JS, and serial/HTTP communication for a robust, real-time system.
| Layer | Tools / Technologies |
|---|---|
| Embedded Logic | Arduino (C++) |
| Web Server | Flask (Python) |
| Frontend | HTML, CSS,JS |
| Communication | Serial (USB) via pySerial |
| Data Format | JSON / plain text |
| Deployment | Localhost or RPi-hosted Flask server |
🧭 System Architecture
Section titled “🧭 System Architecture”Key Takeaway
The architecture links sensors, Arduino, WiFi module, and a Flask web server for seamless data flow and visualization.
+------------+ +-----------------+ +---------------------+ +---------------------+| Sensor(s) | ----> | Arduino/Nano | ---> | Module wifi | --->| Flask Web Server || (Color + IR)| | (ATmega328P) | | (ESP-01) | | (Data Collection +|+------------+ +-----------------+ | | | Visualization) | +---------------------+ +---------------------+🖥️ Web Interface
Section titled “🖥️ Web Interface”Summary
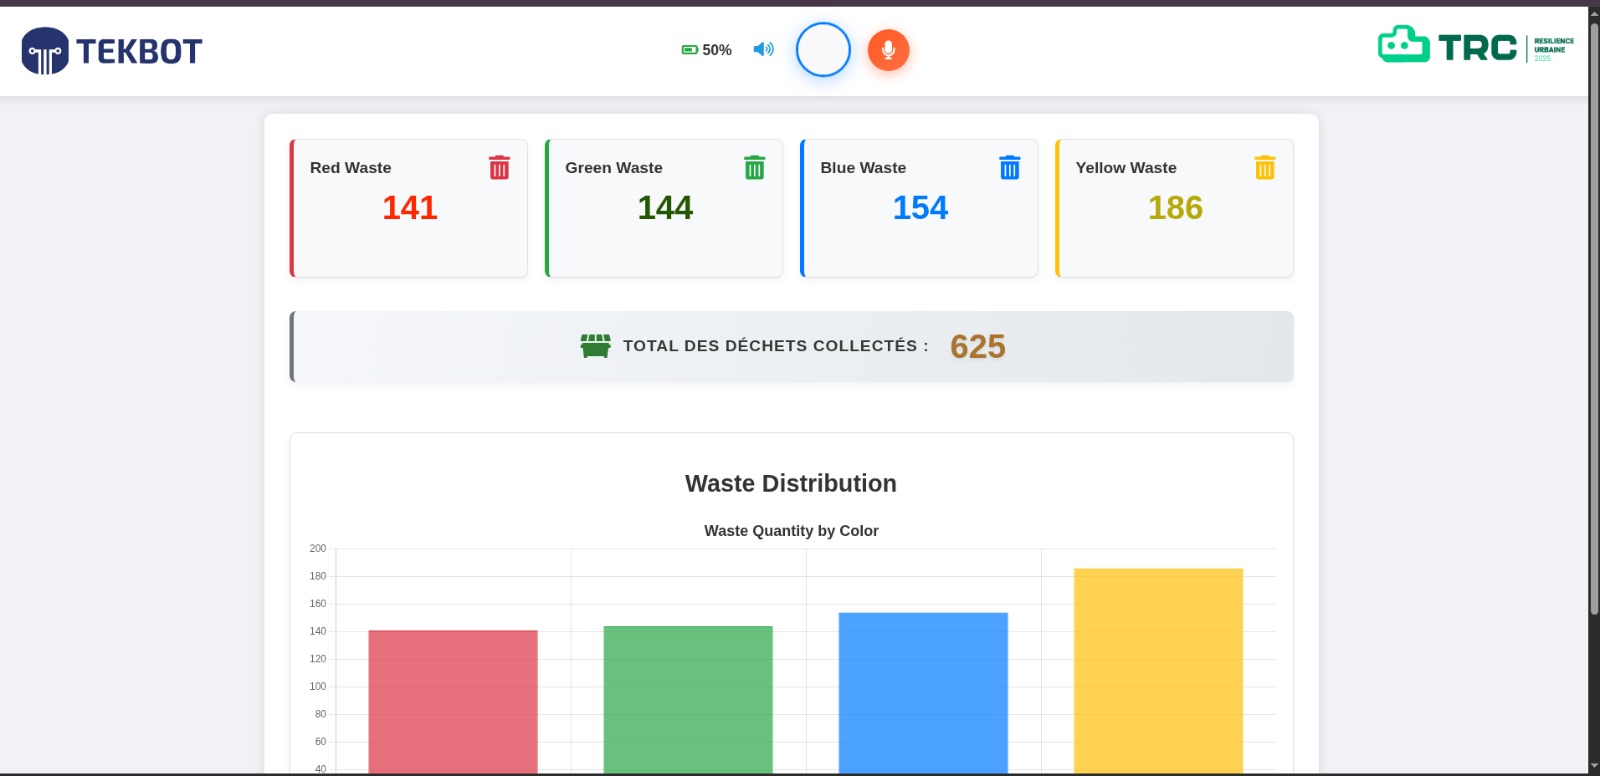
The web interface displays real-time waste counts, system status, battery level, and a dynamic chart, all in a modern, responsive dashboard.
The web interface displays:
- The total count of each waste type (green, yellow, red, blue)
- Real-time updates upon detection
- Embedded logos of TEKBOT and TRC 2025
- A clean and responsive layout
- Battery Display
- Audio
💻 Source Code
Section titled “💻 Source Code”Key Takeaway
The codebase includes Arduino logic for color calibration and detection, ESP8266 code for Wi-Fi data transfer, and Flask server code for data collection and visualization.
🧠 Arduino Embedded Logic
Section titled “🧠 Arduino Embedded Logic”KeepDataColor
Section titled “KeepDataColor”Before calibration, the user selects which color to calibrate (red, green, blue, yellow) via the serial monitor. For each color, the sensor takes several readings, normalizes the RGB values, and calculates the average. These reference values are stored in EEPROM for later use. The process ensures accurate color recognition by adapting to the specific cubes used. The code prints each reading and the final average to help the user verify calibration quality.
#include <Wire.h>#include <Adafruit_TCS34725.h>#include <EEPROM.h>
// Initialisation du capteur TCS34725Adafruit_TCS34725 tcs = Adafruit_TCS34725(TCS34725_INTEGRATIONTIME_50MS, TCS34725_GAIN_4X);
// Structure pour stocker les valeurs de référencestruct ColorRef {  String name;  float r_ref;  float g_ref;  float b_ref;};
// Tableau des couleurs à calibrerColorRef colors[] = {  {"Rouge", 0.0, 0.0, 0.0},  {"Vert", 0.0, 0.0, 0.0},  {"Bleu", 0.0, 0.0, 0.0},  {"Jaune", 0.0, 0.0, 0.0}};const int numColors = 4;const int numReadings = 10; // Nombre de lectures par couleurconst int eepromBaseAddr = 0; // Adresse de départ dans l'EEPROM
void setup() {  Serial.begin(9600);  while (!Serial); // Attendre que le moniteur série soit prêt  if (tcs.begin()) {    Serial.println("Capteur TCS34725 détecté !");  } else {    Serial.println("Erreur : capteur TCS34725 non détecté. Vérifiez les connexions !");    while (1); // Boucle infinlisten
    // Instructions pour l'utilisateur    Serial.println("Programme de calibrage des couleurs.");    Serial.println("Entrez le numéro de la couleur à calibrer :");    Serial.println("1: Rouge, 2: Vert, 3: Bleu, 4: Jaune");  }}
void loop() {  if (Serial.available() > 0) {    int choice = Serial.parseInt();    if (choice >= 1 && choice <= numColors) {      String colorName = colors[choice - 1].name;      Serial.print("Calibration pour "); Serial.print(colorName); Serial.println(". Placez l'échantillon de couleur et attendez...");
      float r_sum = 0.0, g_sum = 0.0, b_sum = 0.0;      int validReadings = 0;
      // Collecter numReadings lectures      for (int i = 0; i < numReadings; i++) {        uint16_t r, g, b, c;        tcs.getRawData(&r, &g, &b, &c);
        // Normaliser les valeurs        float sum = r + g + b;        if (sum == 0) sum = 1; // Éviter la division par zéro        float r_norm = r / sum;        float g_norm = g / sum;        float b_norm = b / sum;
        // Vérifier si la lecture est valide (intensité suffisante)        // if (c > 500) { // Seuil pour éviter le bruit          r_sum += r_norm;          g_sum += g_norm;          b_sum += b_norm;          validReadings++;
          Serial.print("Lecture "); Serial.print(i + 1);          Serial.print(": R_norm="); Serial.print(r_norm, 3);          Serial.print(" G_norm="); Serial.print(g_norm, 3);          Serial.print(" B_norm="); Serial.print(b_norm, 3);          Serial.println();         // } else {         // Serial.println("Lecture ignorée : intensité lumineuse trop faible.");        }        delay(500); // Attendre 500 ms entre les lectures      //}
      // Calculer et afficher la moyenne      if (validReadings > 0) {        colors[choice - 1].r_ref = r_sum / validReadings;        colors[choice - 1].g_ref = g_sum / validReadings;        colors[choice - 1].b_ref = b_sum / validReadings;
        Serial.print("Moyenne pour "); Serial.print(colorName); Serial.print(": ");        Serial.print("R_ref="); Serial.print(colors[choice - 1].r_ref, 3);        Serial.print(" G_ref="); Serial.print(colors[choice - 1].g_ref, 3);        Serial.print(" B_ref="); Serial.print(colors[choice - 1].b_ref, 3);        Serial.print(" (basé sur "); Serial.print(validReadings); Serial.println(" lectures valides)");
        // Sauvegarder dans l'EEPROM        int addr = eepromBaseAddr + (choice - 1) * sizeof(ColorRef);        EEPROM.put(addr, colors[choice - 1]);      } else {        Serial.println("Erreur : aucune lecture valide pour cette couleur.");      }
      // Demander la couleur suivante      Serial.println("\nEntrez le numéro de la couleur suivante (1-4), ou 0 pour terminer :");    } else if (choice == 0) {      // Afficher toutes les valeurs de référence      Serial.println("\nRésultats finaux des valeurs de référence :");      for (int i = 0; i < numColors; i++) {        Serial.print(colors[i].name); Serial.print(": ");        Serial.print("R_ref="); Serial.print(colors[i].r_ref, 3);        Serial.print(" G_ref="); Serial.print(colors[i].g_ref, 3);        Serial.print(" B_ref="); Serial.print(colors[i].b_ref, 3);        Serial.println();      }      Serial.println("Calibration terminée. Copiez ces valeurs dans un fichier.");      while (1); // Arrêter après la calibration    } else {      Serial.println("Choix invalide. Entrez 1-4 pour une couleur, ou 0 pour terminer.");    }    // Vider le tampon série    while (Serial.available() > 0) Serial.read();  }}
algoDistanceColor
Section titled “algoDistanceColor”This code uses the previously calibrated reference values to identify the color of detected objects. For each sensor reading, it normalizes the RGB values and compares them to each reference color using Euclidean distance. The closest match is selected, provided the light intensity is sufficient and the distance is below a threshold. The detected color is printed to the serial monitor, allowing real-time tracking of waste sorting.
#include <Wire.h>#include <Adafruit_TCS34725.h>#include <EEPROM.h>#include <math.h>
// Initialisation du capteur TCS34725Adafruit_TCS34725 tcs = Adafruit_TCS34725(TCS34725_INTEGRATIONTIME_50MS, TCS34725_GAIN_4X);
// Structure pour stocker les valeurs de référencestruct ColorRef {  String name;  float r_ref;  float g_ref;  float b_ref;};
// Tableau des couleurs de référence (valeurs par défaut si EEPROM vide)ColorRef colors[] = {  {"Rouge", 0.8, 0.1, 0.1},  {"Vert", 0.1, 0.8, 0.1},  {"Bleu", 0.1, 0.1, 0.8},  {"Jaune", 0.5, 0.45, 0.05}};const int numColors = 4;const int eepromBaseAddr = 0; // Adresse de départ dans l'EEPROM
void setup() {  Serial.begin(9600);  while (!Serial); // Attendre que le moniteur série soit prêt  if (tcs.begin()) {    Serial.println("Capteur TCS34725 détecté !");  } else {    Serial.println("Erreur : capteur TCS34725 non détecté. Vérifiez les connexions !");    while (1); // Boucle infinie en cas d'erreur  }
  // Charger les valeurs de référence depuis l'EEPROM  for (int i = 0; i < numColors; i++) {    ColorRef temp;    EEPROM.get(eepromBaseAddr + i * sizeof(ColorRef), temp);    // Vérifier si les valeurs sont valides (non nulles et cohérentes)    if (temp.r_ref + temp.g_ref + temp.b_ref > 0.1) { // Somme non nulle      colors[i] = temp;    }  }
  // Afficher les valeurs de référence utilisées  Serial.println("Valeurs de référence utilisées :");  for (int i = 0; i < numColors; i++) {    Serial.print(colors[i].name); Serial.print(": ");    Serial.print("R_ref="); Serial.print(colors[i].r_ref, 3);    Serial.print(" G_ref="); Serial.print(colors[i].g_ref, 3);    Serial.print(" B_ref="); Serial.print(colors[i].b_ref, 3);    Serial.println();  }}
void loop() {  uint16_t r, g, b, c;  float r_norm, g_norm, b_norm;
  // Lire les données brutes du capteur  tcs.getRawData(&r, &g, &b, &c);
  // Normaliser les valeurs RVB  float sum = r + g + b;  if (sum == 0) sum = 1; // Éviter la division par zéro  r_norm = r / sum;  g_norm = g / sum;  b_norm = b / sum;
  // Afficher les valeurs normalisées pour débogage  Serial.print("R_norm: "); Serial.print(r_norm, 3);  Serial.print(" G_norm: "); Serial.print(g_norm, 3);  Serial.print(" B_norm: "); Serial.print(b_norm, 3);  Serial.print(" Clear: "); Serial.println(c);
  // Trouver la couleur la plus proche  String detectedColor = "Inconnue";  float minDistance = 1000.0; // Valeur initiale élevée  for (int i = 0; i < numColors; i++) {    // Calculer la distance euclidienne    float distance = sqrt(      pow(r_norm - colors[i].r_ref, 2) +      pow(g_norm - colors[i].g_ref, 2) +      pow(b_norm - colors[i].b_ref, 2)    );
    // Afficher la distance pour débogage    Serial.print("Distance à "); Serial.print(colors[i].name);    Serial.print(": "); Serial.println(distance, 3);
    // Mettre à jour la couleur détectée si la distance est plus faible    if (distance < minDistance) {      minDistance = distance;      detectedColor = colors[i].name;    }  }
  // Vérifier le seuil de distance et l'intensité lumineuse  if (minDistance > 0.3 || c < 1000) {    detectedColor = "Inconnue (distance trop grande ou lumière faible)";  }
  // Afficher la couleur détectée  Serial.print("Couleur détectée : "); Serial.println(detectedColor);  Serial.println("---");
  delay(1000); // Attendre 1 seconde avant la prochaine lecture}
🌐 Flask Web Server
Section titled “🌐 Flask Web Server”Summary
The ESP8266 connects to Wi-Fi and sends HTTP requests to the Flask server, enabling real-time data transfer from the microcontroller to the dashboard.
#include <ESP8266WiFi.h>#include <ESP8266HTTPClient.h>#include <WiFiClient.h>#include <ArduinoJson.h> // Nécessaire pour envoyer du JSON
const char* ssid = "MOOVAFRICA_320139";const char* password = "b2652aa6";
// --- Configuration du serveur Flask ---const char* flaskServerHost = "192.168.1.100";const int flaskServerPort = 5000;const char* apiEndpoint = "/api/set?color=blue"; // Le chemin de l'API sur votre serveur Flask
unsigned long previousMillis = 0;const long interval = 2000; // Intervalle d'envoi des données (en ms)
void setup() {  Serial.begin(115200);  delay(10);  Serial.println();  Serial.print("Connecting to ");  Serial.println(ssid);
  WiFi.begin(ssid, password);
  // Attendre la connexion Wi-Fi  int retries = 0;  while (WiFi.status() != WL_CONNECTED) {    delay(500);    Serial.print(".");    retries++;    if (retries > 20) {      Serial.println("\nFailed to connect to WiFi. Please check SSID/Password and signal.");    }  }
  Serial.println("");  Serial.println("WiFi connected");  Serial.println("IP address: ");  Serial.println(WiFi.localIP());}
void loop() {  unsigned long currentMillis = millis();
  if (currentMillis - previousMillis >= interval) {    previousMillis = currentMillis;
    WiFiClient client;    HTTPClient http;
    String serverPath = "http://" + String(flaskServerHost) + ":" + String(flaskServerPort) + String(apiEndpoint);
    Serial.print("[HTTP] begin...\n");    if (http.begin(client, serverPath)) {      Serial.print("[HTTP] GET...\n");
      int httpCode = http.GET();
      if (httpCode > 0) {        Serial.printf("[HTTP] GET... code: %d\n", httpCode);
        if (httpCode == HTTP_CODE_OK || httpCode == HTTP_CODE_MOVED_PERMANENTLY) {          String payload = http.getString();          Serial.println(payload);        }      } else {        Serial.printf("[HTTP] POST... failed, error: %s\n", http.errorToString(httpCode).c_str());      }
      http.end();    } else {      Serial.printf("[HTTP] Unable to connect\n");    }  }  yield();}
🖼️ Web Dashboard (HTML Template)
Section titled “🖼️ Web Dashboard (HTML Template)”Key Takeaway
The dashboard is responsive, user-friendly, and visually summarizes all waste data in real time.
<!DOCTYPE html><html lang="en"><head>    <meta charset="UTF-8" />    <meta name="viewport" content="width=device-width, initial-scale=1.0"/>    <title>TekBot | DashBoard</title>    <link rel="stylesheet" href="../static/style.css"/>    <link rel="stylesheet" href="https://cdnjs.cloudflare.com/ajax/libs/font-awesome/6.0.0-beta3/css/all.min.css"/>    <script src="https://cdn.jsdelivr.net/npm/chart.js"></script></head><body>    <nav class="navbar">    <div class="navbar-left">        <img src="../static/logo.png" alt="Logo Tekbot" class="logo" />    </div>    <div class="navbar-utils">        <div class="battery-info">            <i class="fas fa-battery-three-quarters battery-icon"></i>            <span class="battery-level">--%</span>        </div>        <button class="volume-btn" onclick="lireRapport()">            <i class="fas fa-volume-up volume-icon"></i>        </button>    </div>    <div class="navbar-right">        <img src="../static/trc.png" alt="Logo TRC" class="logo" />    </div></nav>
  <div class="dashboard-container">    <div class="card-section">
      <div class="card red">        <div class="card-header">          <h3>Red Waste</h3>          <i class="fa-solid fa-trash-can waste-icon"></i>        </div>        <p class="value"><span id="rouge-count">{{ red }}</span></p>      </div>
      <div class="card green">        <div class="card-header">          <h3>Green Waste</h3>          <i class="fa-solid fa-trash-can waste-icon"></i>        </div>        <p class="value1"><span id="vert-count">{{ green }}</span></p>      </div>
      <div class="card blue">        <div class="card-header">          <h3>Blue Waste</h3>          <i class="fa-solid fa-trash-can waste-icon"></i>        </div>        <p class="value2"><span id="bleu-count">{{ blue }}</span></p>      </div>
      <div class="card yellow">        <div class="card-header">          <h3>Yellow Waste</h3>          <i class="fa-solid fa-trash-can waste-icon"></i>        </div>        <p class="value3"><span id="jaune-count">{{ yellow }}</span></p>      </div>
     <!-- Carte du Total (nouvelle structure) -->    <div class="total-card">        <div class="total-content">            <i class="fas fa-dumpster total-icon"></i>            <div class="total-text">Total des déchets collectés :</div>            <div class="total-value" id="total-count">{{ red + green + blue + yellow }}</div>        </div>    </div>

    <!-- Graphique ( -->    <div class="chart-fullwidth">        <h2 class="chart-title">Waste Distribution</h2>        <canvas id="wasteHistogram"></canvas>    </div>  <script src="../static/script.js"></script></body></html>
🎥 Demo Videos
Section titled “🎥 Demo Videos”Key Takeaway
The demo shows real-time data flow from the ROS2 publisher to the web dashboard, with instant updates and dynamic visualization.
Demo Description:
A ROS node publisher generates random waste colors and sends them to the system. The web interface receives these updates, automatically refreshes the waste counts, and displays the changes in real time. This demonstrates the live data flow and dynamic dashboard updates for the smart conveyor system.
Simulation Interface avec ROS
🧪 Results & Testing
Section titled “🧪 Results & Testing”Summary
The system was tested for detection, sorting, real-time updates, and interface clarity, all with successful outcomes.
| Test Scenario | Expected Result | Outcome |
|---|---|---|
| Waste detected and identified correctly | Color is logged and counted | ✅ Success |
| Motor activates only when needed | Conveyor runs during detection | ✅ Success |
| Real-time interface update | Dashboard shows new counts instantly | ✅ Success |
| Interface displays all 4 types clearly | All colors tracked | ✅ Success |
| TRC & TEKBOT logos visible | Logos displayed | ✅ Success |
📚 References
Section titled “📚 References”Key Takeaway
Documentation and resources for Arduino, Flask, Chart.js, and hardware components.
Arduino Documentation
Section titled “Arduino Documentation”- Arduino Official Documentation
- Adafruit TCS34725 Color Sensor Guide
- EEPROM Library Reference
- Serial Communication Reference
Flask & Web Dashboard
Section titled “Flask & Web Dashboard”Hardware & Design
Section titled “Hardware & Design”👥 Team
Section titled “👥 Team”Key Takeaway
Project developed by a multidisciplinary team for the TEKBOT Robotics Challenge 2025.
- Marzoukath AGBODJA
- Ifè Leonce COMLAN
- Larissa CHATIGRE
Final Project – TEKBOT Robotics Challenge 2025
Domain: IT
Stack: Arduino (C++) + Flask + HTML/CSS
© 2025 TEKBOT Robotics Challenge